DanubeSediment Danube Sediment Management - Restoration of the Sediment Balance in the Danube River
Interactive Maps
In order to make our results more understandable, we have used “Interactive maps” that visualise these results! Check out the maps and find out more about sediment in the Danube River Basin!
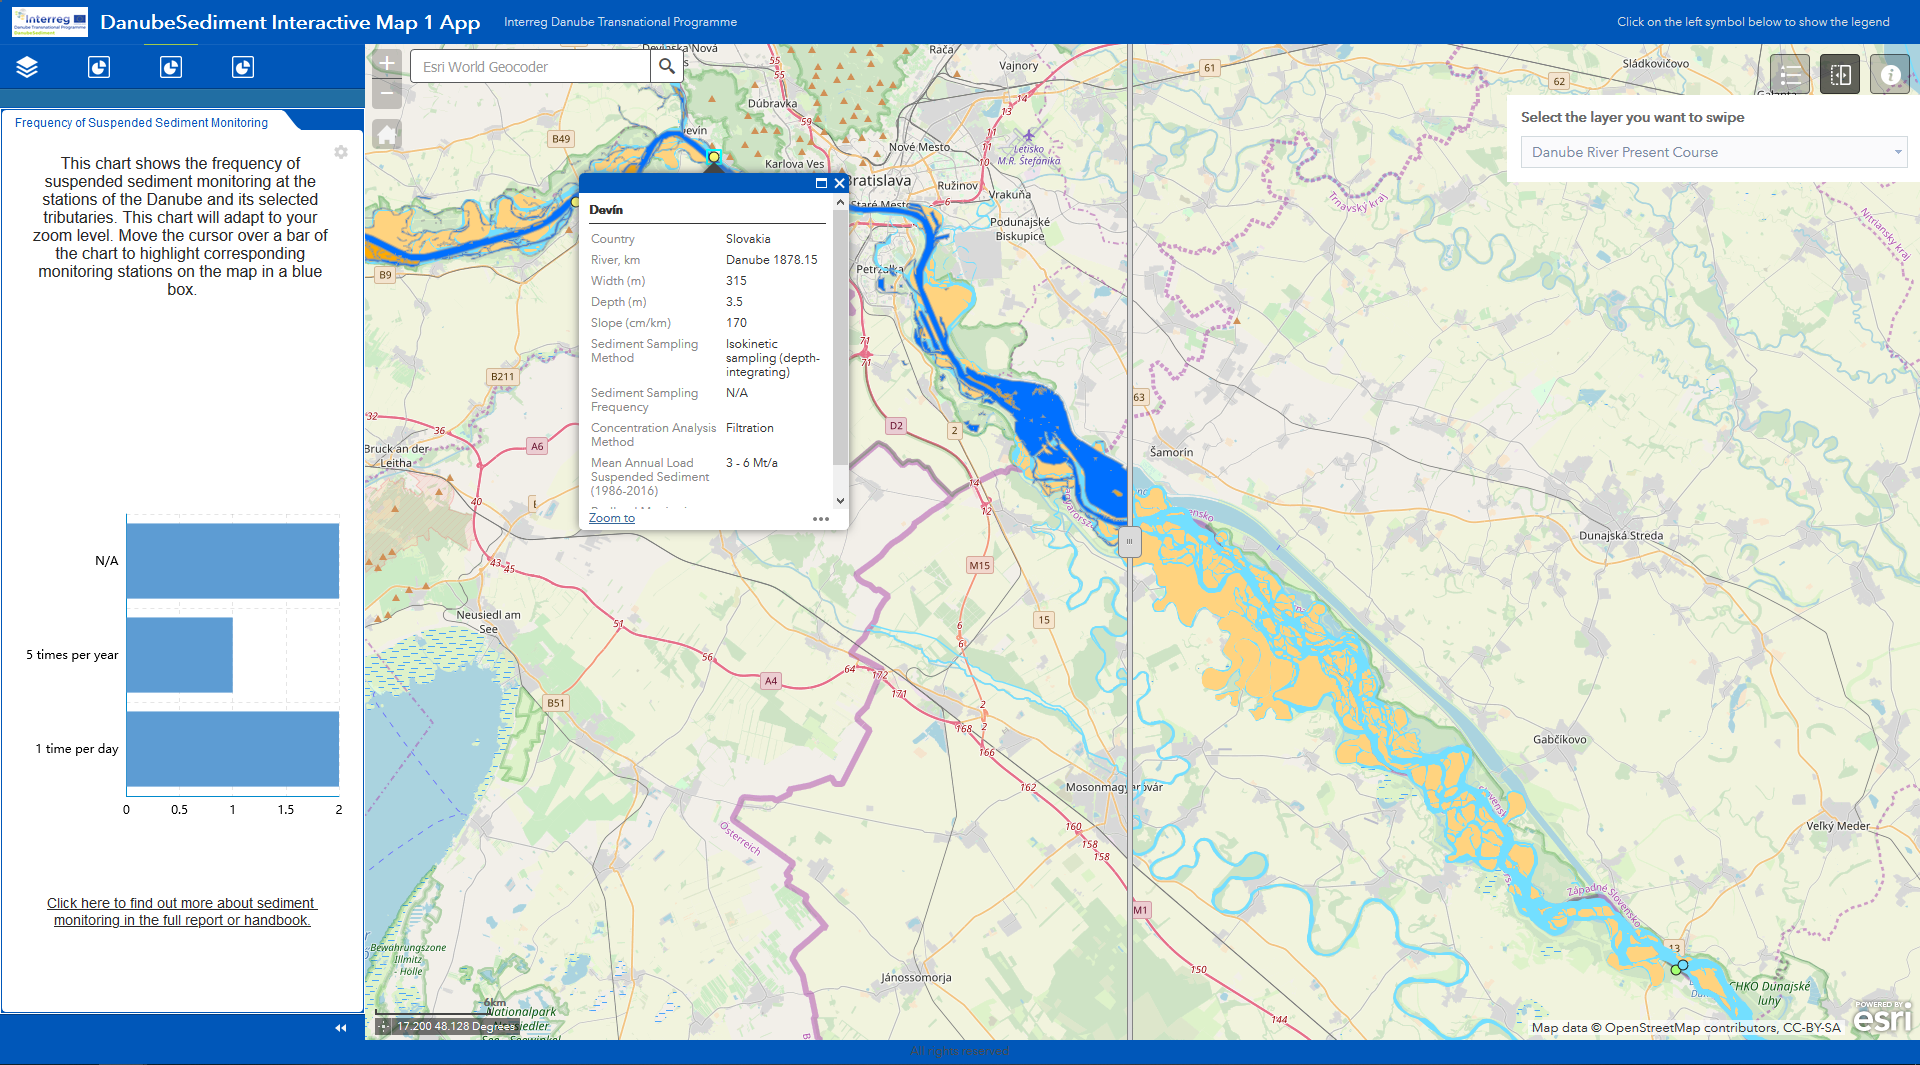
Map 1 contains sediment monitoring stations along the Danube River and its most relevant tributaries. This map includes information on the measurement data collected and an interesting analysis of the data shown as pie charts.
In addition, you will not only see the present course of the Danube River, but also the historic course, including historic islands. By using the “Sliding-Tool”, you can compare the changes over space and time. Click here to get to the map.
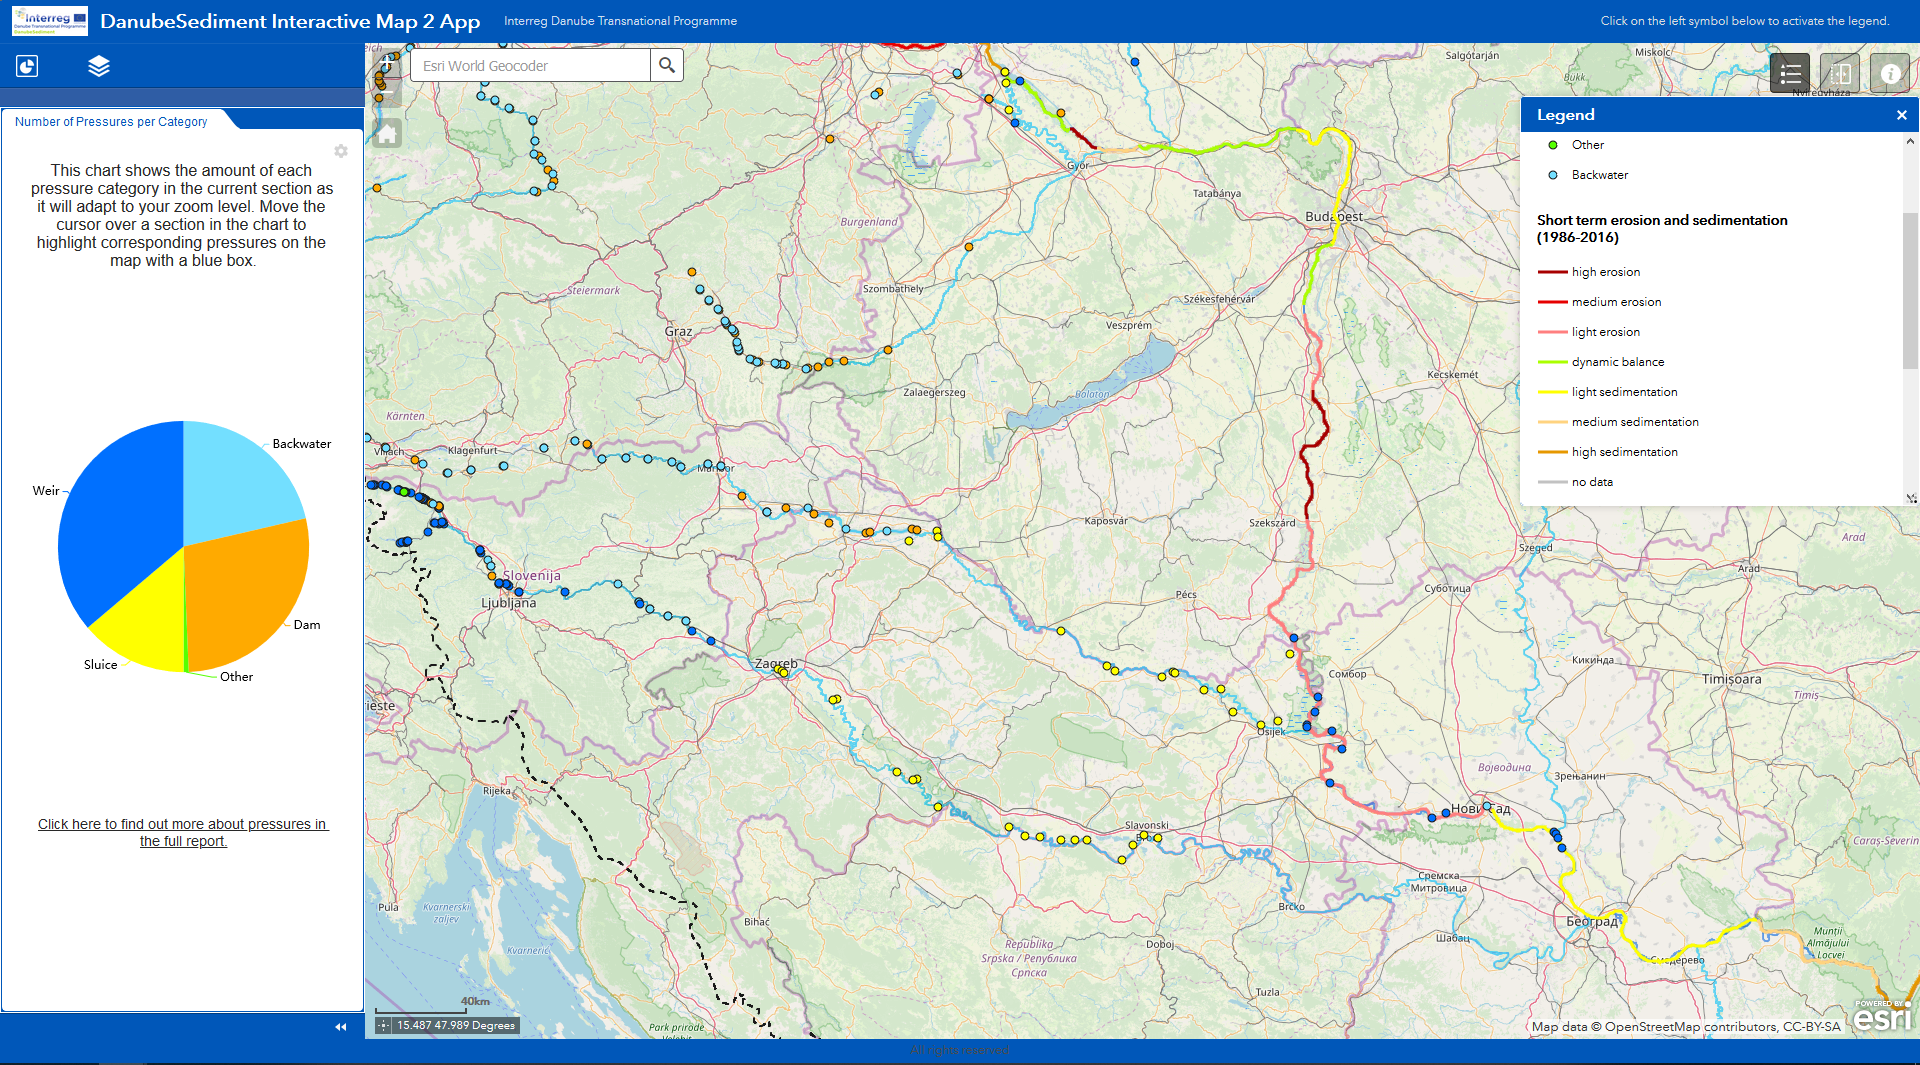
Map 2 shows the pressures that act on the sediment regime, divided into five types. An interactive pie chart will adapt to your zoom level, showing you the distribution of these pressures in the current section. Furthermore, differently coloured stretches of the Danube River indicate section with sedimentation and erosion. Click here to get to the map.