DriDanube - Drought Watch
02-05-2019
When dealing with drought we first need to understand in which stage we are and what to do during that particular stage. Being aware of what is going on „here and now“ is a key to our actions. Furthermore, detecting drought in its early stage will allow for more accurate and well-thought-out reactions.
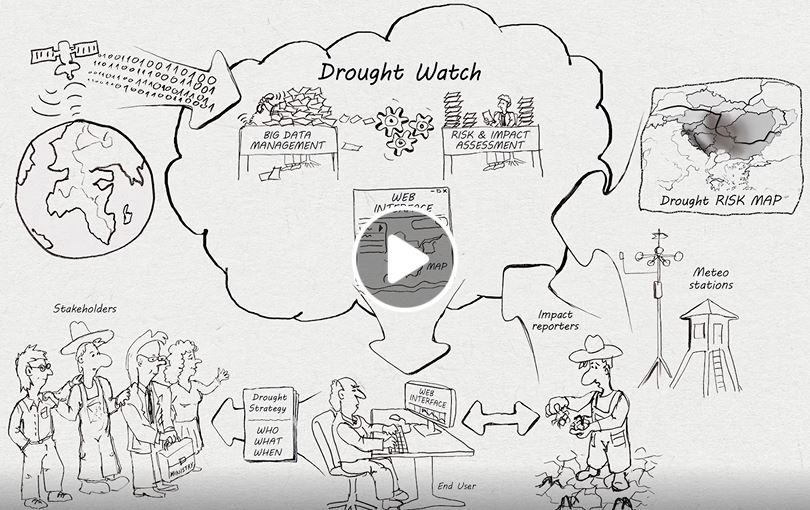
DriDanube partners developed an innovative and interactive tool Drought Watch which will enable more accurate and efficient drought monitoring and early warning for the entire Danube region. This tool will serve the need of understanding the stage of drought and will help to improve operational day-to-day work of wide range of end users in all phases of drought. It can be a great tool not only for the drought experts, meteorologists, water managers or farmers but also for the decision makers to monitor and detect droughts on transboundary level to be able to make appropriate decisions leading to application of mitigation measures. To avoid bigger losses and impacts of drought, timely and proactive steps are crucial that can be done based on Drought Watch data.
Drought Watch includes a set of Earth Observation data from a range of operational remote sensing satellites, data from meteorological stations and drought impact reports processed into ready-to-use drought information available to general public with a web interface at http://www.droughtwatch.eu/
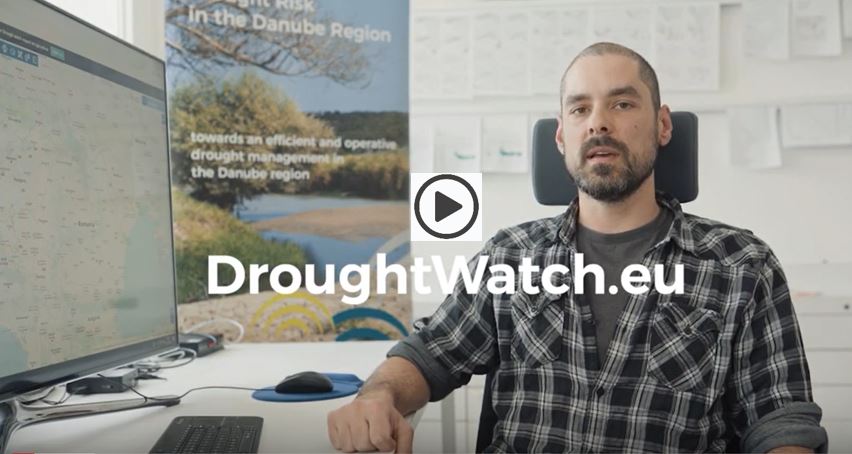
To understand how Drought Watch functions and what data it involves, check our new video about the tool:
Drought Watch offers diverse functionalities and displays various drought related datasets (see some of the examples below):
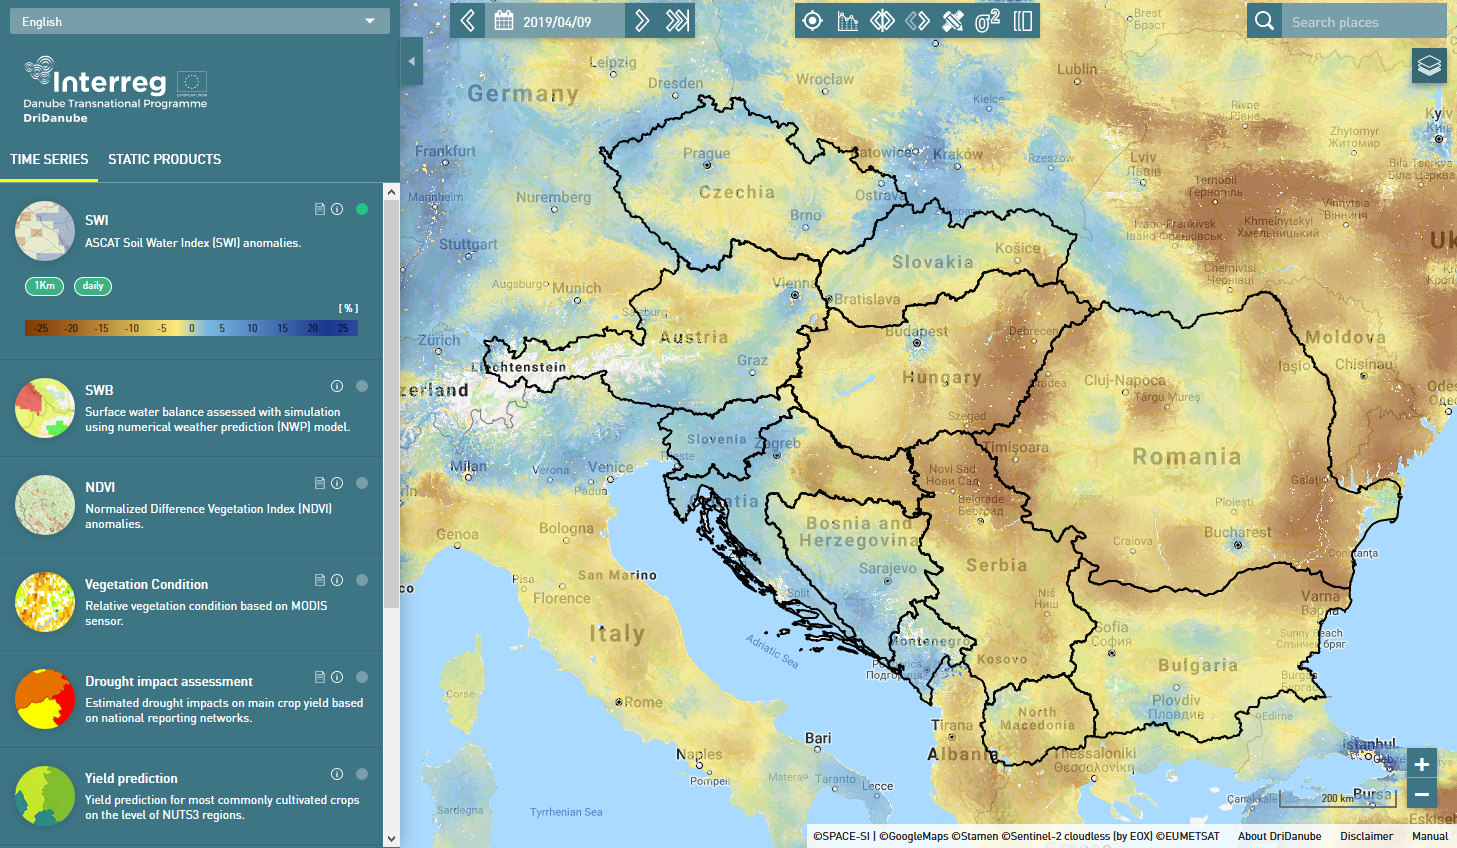
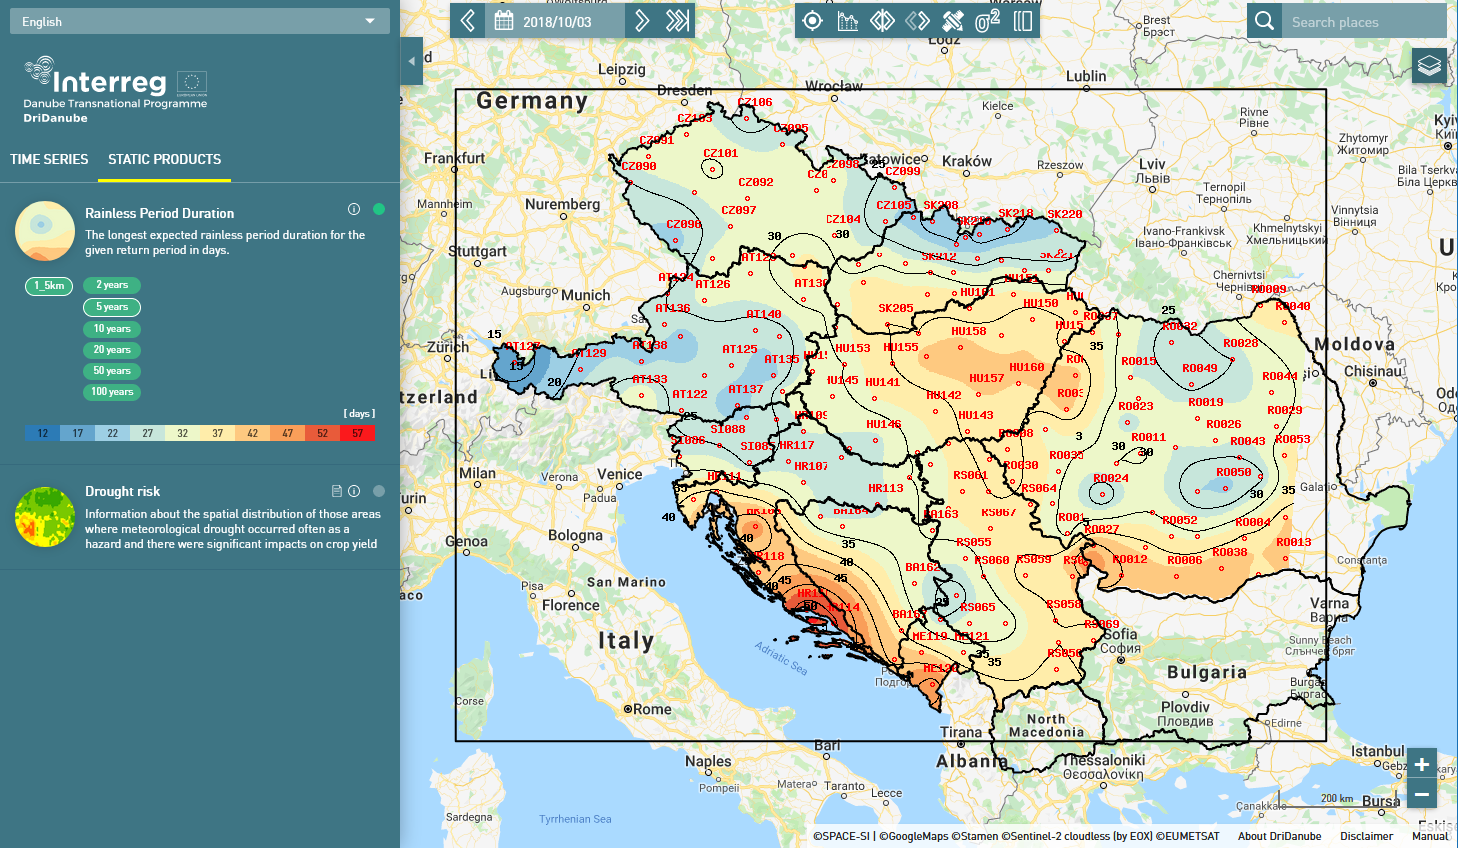
Soil Water Index, 9 March 2019 Rainless period during vegetation season - 5-year return period


Impacts on main agric. crops, 14 April 2019 Risk map for estimated maize yield loss - 20 % probability level
To help the users to efficiently work with the tool we have also prepared a Drought Watch Video Tutorial that provides clear instruction how to use its components to analyze a drought event. See more in this video tutorial:
Drought Watch prototype was prepared already in the spring 2018 and DriDanube partners tested its use by monitoring the drought situation during the summer 2018 and at the beginning of 2019. You can check our Drought 2018 Watch section and Regional drought situation review (January – April 2019) for the Regional drought bulletins we published together with the maps documenting the situation during the testing phase. Moreover you can also read here the summary of the season 2018 on how drought affected us.